Sr. BI & Data Analytics Consultant

Turning complex data into measurable business outcomes

10+ years building the analytics that marketing, finance, operations and clinical teams rely on: from Azure SQL pipelines and Salesforce automation to executive dashboards and spend forecasts.

Power BI · Tableau SQL · Python Azure · SSIS Salesforce · Marketing Cloud Marketing Analytics
Portrait of Sakhawat Ali in a navy suit and burgundy tie

About

Analytics that teams actually act on

I work across Marketing, Finance, Operations, Contact Center and clinical research, turning business questions into data models, and data models into decisions.

Over a decade I have moved from healthcare data migrations, to e-commerce BI, to end-to-end analytics consulting for a multi-location healthcare group. The common thread: measurable outcomes, cross-functional leadership, and dashboards people trust.

80+
providers implemented from legacy systems
200+
custom SQL data extensions in Marketing Cloud
87%
fewer client-data migration errors via QA automation
2 wks → 5 days
monthly financial close, after automating bank data

Selected work

Three analyses, three headline results

Each case study opens a full interactive report with dashboards, filters and methodology.

E-commerce · Forecasting

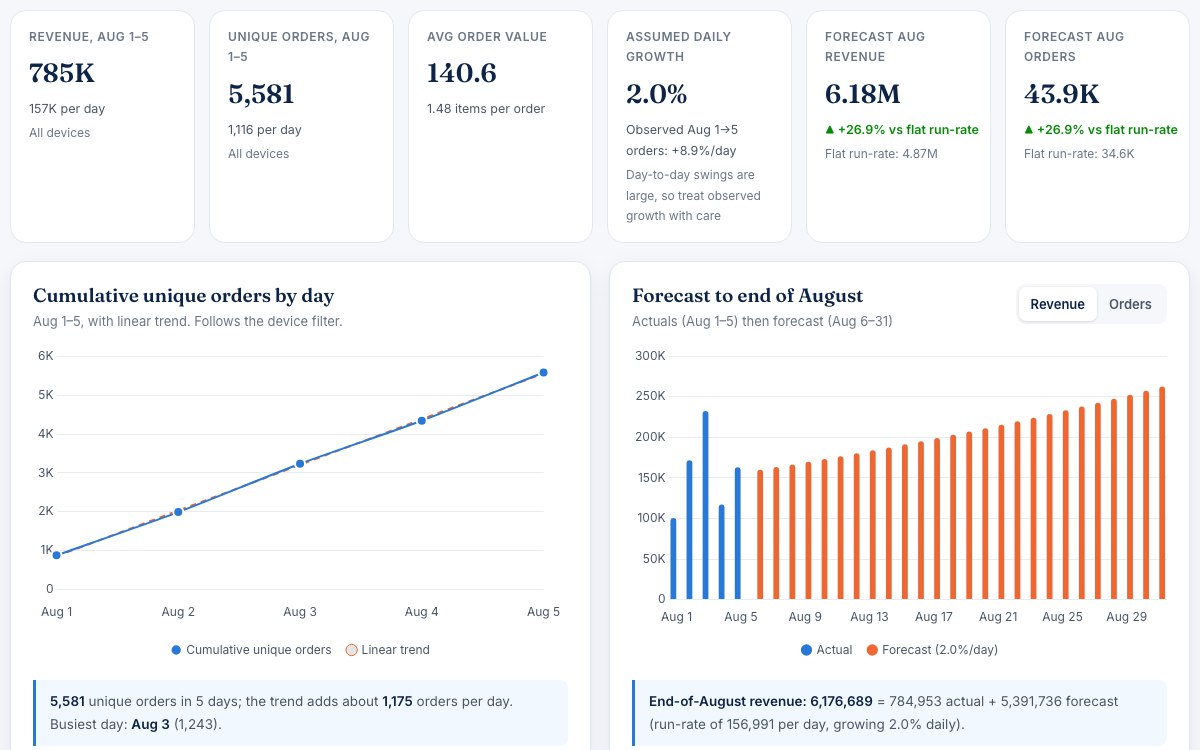
Month-End Revenue & Order Forecast

A month-end forecast built from just a few days of order data, with device-level scenarios and an adjustable growth rate.

  • of revenue comes from desktop, on of orders
  • forecast upside vs a flat run-rate at 2% daily growth
  • of delivery cost recovered by shipping fees
ForecastingTrend analysisDevice mix

Healthcare · Ad spend & revenue

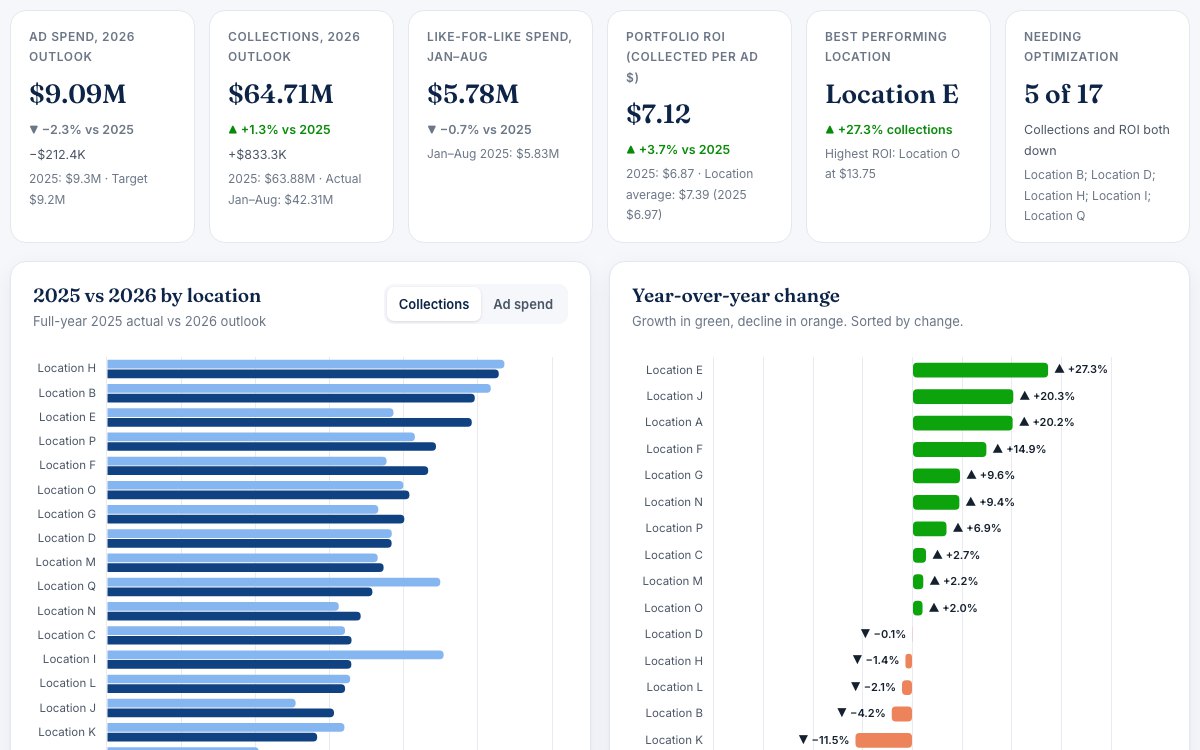
Ad Budget & Revenue: 2025 vs 2026

Year-over-year spend, collections and return across practice locations, with quadrant analysis to guide budget shifts.

  • more collections on less ad spend (2026 outlook)
  • → collected per ad dollar, up
  • of locations on course to grow collections
YoY analysisROI by locationBudget allocation

Healthcare · Campaign & funnel

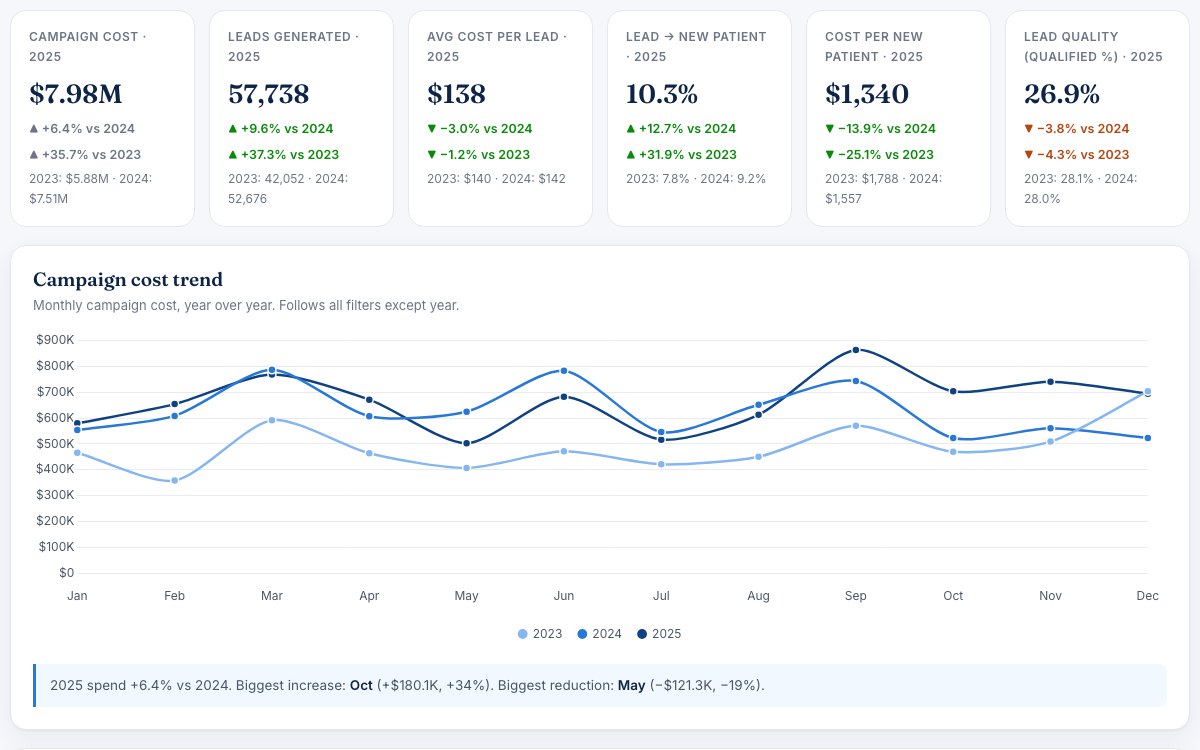
Campaign Cost & Lead Funnel, –

Three years of campaign cost and lead-funnel data, sliced by practice, market, media type, lead type and vendor.

  • −cost per new patient: to
  • +new patients on more campaign cost
  • → lead-to-new-patient conversion
Funnel analyticsMedia mixMulti-filter

Technical toolkit

The stack behind the analysis

01 · Visualization

BI & Visualization

  • Tableau
  • Power BI
  • Sisense
  • Looker Studio
  • KPI frameworks
  • Executive & commercial reporting
02 · Data

Data & SQL

  • T-SQL, MySQL, PostgreSQL
  • DAX
  • Python, R
  • Data modeling & star schema
  • Data quality
03 · Engineering

Data Engineering

  • SSIS
  • Azure SQL & Data Factory
  • Apache Spark
  • ETL & pipeline design
  • Data warehousing
04 · Marketing

Marketing Analytics

  • Campaign performance
  • Media spend & forecasting
  • Funnel analytics
  • Segmentation
  • GA4 & GTM
05 · CRM

Salesforce

  • CRM / Lightning
  • Lead routing & conversion automation
  • Marketing Cloud
  • SQL data extensions
06 · Cloud

Cloud & Automation

  • Azure, AWS, BigQuery
  • Power Automate
  • Alteryx, GitHub
  • Cloud migration
07 · Analytics

Advanced Analytics

  • Statistical analysis
  • Forecasting
  • Audience segmentation
  • Clinical data analysis
08 · Leadership

Leadership

  • Stakeholder management
  • Cross-functional consulting
  • Team building & mentorship
  • Project leadership

Track record

Results behind the roles

  1. Sr. BI & Data Analytics Consultant

    Arthritis Knee Pain Centers · USA, remote · Feb 2023 – Present

    • Optimized ad spend by ~5% while contributing to consistent year-over-year lead growth, despite rising TV and digital media costs.
    • Built a -location ad-spend vs collections dashboard: the 2026 outlook collects ~ more (+) on ~ less spend, lifting collections per ad dollar from to .
    • Delivered – funnel analytics: cost per new patient fell ( to ) as new patients grew and lead-to-patient conversion rose from to .
    • Identified digital marketing as the most cost-efficient channel ( per new patient in vs in ) and flagged under-performing market/media combinations.
    • Cut a recurring Finance ad-spend report from ~20 hours/week to ~10 minutes/week; helped reduce monthly close from ~2 weeks to 5 days.
    • Designed Salesforce lead-routing and lifecycle automation; built 200+ SQL Data Extensions for Marketing Cloud journeys.
    • Supported two clinical studies with statistical analysis and data validation.
  2. Senior BI & Data Analyst

    Kaidee · Thailand · Nov 2021 – Jan 2023

    • Reduced Sisense cube size by up to 80% and build time by up to 30%.
    • Built ETL flows from OLTP systems to the warehouse, plus a competitor-reporting platform for the automotive vertical (up to 5% growth in featured-listing sales).
    • Built a month-end revenue and order forecast from just days of order data, with device-level scenarios. It showed desktop drives of revenue on of orders, and that shipping fees recover only of delivery cost, flagging a logistics-cost opportunity.
    • Developed a call-center shift-planning framework that lifted qualification rate by up to 3%.
  3. Sr. Application Analyst

    CureMD Research & Development · Pakistan · Jan 2018 – Nov 2021

    • Implemented 80+ providers from legacy systems; audited EMR and billing for 200+ practices.
    • Supervised QA automation for client data migration, reducing migration errors by 87.21%.
    • Extended the CCDA interoperability utility (Python, T-SQL), saving 2–6 weeks per migration.
A small white and orange AI assistant robot, smiling, holding a tablet and pointing Plan · Act · Learn

Perspective

Where agentic AI takes the automation next

The automation below already runs on rules I built by hand. Agentic AI is the same instinct taken further: a system that plans a task, checks its own work, and asks only when it's unsure – applied to the reporting and monitoring hours that still eat an analyst's week.

20 hrs → 10 minWeekly ad-spend report, rule-based
2 wks → 5 daysMonthly financial close
200+Marketing Cloud extensions

How agentic AI works

Four stages, on a loop – each run feeding the next.

Agentic AIPlan · Act · Learn
1 · Goal

A stakeholder states the outcome

“Tell me why ad spend missed target” – not the steps to get there.

2 · Plan

The agent breaks it into steps

Which tables to query, which report to update, who to notify.

3 · Act

It runs the steps

Pulls data, drafts the narrative, flags anomalies, with the tools an analyst would use.

4 · Learn

It checks the result

Compares the outcome to what happened and adjusts, with a human reviewing before anything ships.

Where I’d point an agent in BI

Self-drafting reports

An agent that watches the dashboards I already automate and drafts the executive summary and anomaly callouts before anyone opens the file – turning a reporting job into a five-minute review.

Autonomous monitoring & fixes

An agent sitting on a pipeline around the clock, catching a broken load or a stale metric before a stakeholder does, and opening a ticket with the root cause already attached.

Plain-English access to the warehouse

Ask a question in ordinary language and get back a validated chart, not a support ticket – so the team spends less time waiting on an analyst for numbers that already exist.

How I’d bring it into a BI team

  1. 1
    Start where the automation already lives.

    Turn the rule-based reports, like the ad-spend one above, into agent-drafted narratives, with a human sign-off before anything goes out.

  2. 2
    Give the agent read-only access first.

    Pipeline monitoring and anomaly flags before any agent is allowed to change data or push a report on its own.

  3. 3
    Log every agent action like a person's.

    So a wrong call is as easy to trace and reverse as a human one, with the same audit trail as the data-quality checks I run today.

  4. 4
    Expand scope only after a clean run.

    From monitoring, to drafting, to acting – one step at a time, and only once the step before it has held up.

✓ Increases productivity and efficiency ✓ Handles complex, multi-step tasks ✓ Reduces manual, repeatable work ✓ Improves decisions with real data

This is where I see agentic AI adding the most value in BI: taking over the reporting and monitoring hours already being automated by rule, not replacing the judgment calls that still need a person.

Resume

The full record, one download away

Sr. BI & Data Analytics Consultant with 10+ years across BI, data engineering, Salesforce and marketing analytics.

Credentials

Microsoft-certified across analytics, SQL and Azure

    Also passed Microsoft Exam 761 (Querying Data with Transact-SQL) and Exam 762 (Developing SQL Databases), October 2020. Education: Board of Intermediate and Secondary Education, F.Sc. Pre-Medical, Lahore (2008–2010).

    Contact

    Let’s talk about your data

    Get in touch

    Based in Lahore, Pakistan and working remotely with US teams. Send a note and I will reply within a couple of working days.

    • Emailsakhawat2203@gmail.com
      Send email
    • Phone(+92) 324 7979968
      Call
    • LinkedInlinkedin.com/in/sakhawat-ali-33277b187
      Visit ↗

    Send a message